
Largest crisis in the Phanerozoic history of life
The end-Permian mass extinction event was the most devastating in the history of the Earth.
Marking the end of the great Palaeozoic era, it saw to the death of about 95% of marine species and 70% of land families. This is the most extensive extinction event ever, the closest that metazoans have come to being exterminated since they first evolved in the Cambrian.
The following diagram shows the number of marine species present on Earth through the Phanerozoic, the past 540 million years of ‘abundant life’. The mass extinctions can be seen as sharp declines from the overall rising diversity curve. There have been 5 major mass extinctions, the ‘big five’, of which the Permo-Triassic crisis was the greatest.
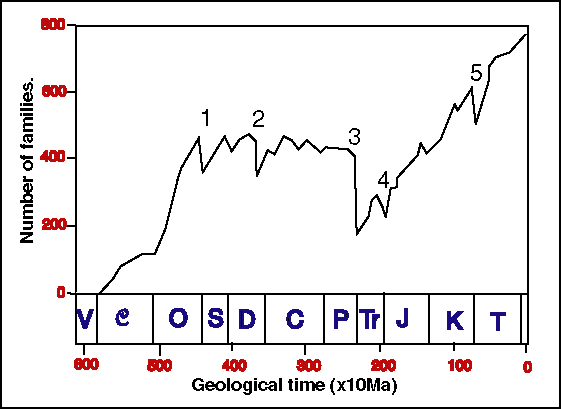
The ‘big five’ mass extinctions: (1) late Ordovician, (2) late Devonian, (3) Permo-Triassic, (4) end-Triassic, (5) end-Cretaceous. After Jack Sepkoski, Jr.
Calculating the scale of the global species loss
Many animal groups suffered major losses during the Permo-Triassic mass extinction (PTME). Extinctions of previously dominant and ecologically important groups caused the collapse of many biological communities. It took several million years for complex communities to recover, both in the oceans and on land (Chen and Benton 2012). Estimating the severity of past extinction events is not easy. Palaeontologists focus on genera or families when discussing long-term, global changes in biodiversity because preservation becomes patchier at the species level and true biological species are hard to recognize from fossil remains. Estimates of losses during the Permo-Triassic mass extinction are 49% (Sepksoki 1996) or 48.6% (Benton 1995) of marine animal families, 62.9% of families of continental organisms (Benton 1995), and 60.9% of all life (Benton 1995).
The level of extinction at lower taxonomic levels was then estimated by Raup (1976) using a reverse rarefaction technique. This is based on the intuitive idea that the loss of 50% of families must equate to the loss of a much higher proportion of species: for a family to go extinct, every species in it must die out. The loss of 50% of families must mean that the other, surviving families are also hit hard, but if only one out of 100 species in a family survive, that family is deemed to survive. From this method, it is estimated that 96% of marine species were lost during the end-Permian extinction event (Raup 1976).
However, this calculation assumes random species extinction across all families (i.e. no selectivity against certain groups), which is not true (McKinney 1995). The rarefaction technique might overestimate species extinction levels by 10-15%, so the real magnitude of the end-Permian event might be closer to 80% species loss.
…and at regional scale
It will probably be impossible ever to establish the global loss of species, except by this kind of extrapolation. However, it is remarkable that the same kinds of figures for species loss (90%) are found in regional-scale studies in the exceptional marine rock sequences in South China. Jin et al. (2000) found an overall loss of 90% of species in a first study. Song et al. (2013) confirm this finding, identifying two pulses of extinction. In the first phase, 57% of species disappeared, including all plankton and some benthic groups, including algae, rugose corals, and fusulinid forams. The second phase saw the extinction of 71% of the remaining species. When both events are combined, they saw the end of 90% of latest Permian species through the PTME.
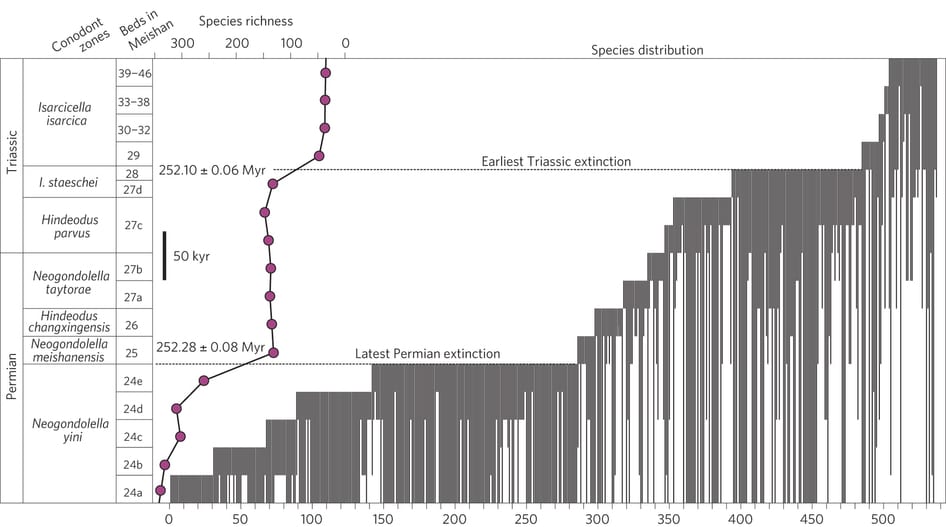
The extinction of life at the end of the Permian in southern China, showing two key extinction levels, one in the latest Permian, and the second in the earliest Triassic, separated by 180,000 years. The stratigraphy is based on conodont zones, the bed numbers are from the Meishan type Permo-Triassic boundary section, and a plot of species richness through time is shown. Vertical bars are ranges of 537 marine species that span through these beds. Based on Song et al. (2013).
References
- Benton, M.J. 1995. Diversification and extinction in the history of life. Science 268, 52-58. Download pdf.
- Chen, Z.Q. and Benton, M.J. 2012. The timing and pattern of biotic recovery following the end-Permian mass extinction. Nature Geoscience 5, 375-383 (doi:10.1038/ngeo1475). Download pdf.
- Jin, Y. G. et al. 2000. Pattern of marine mass extinction near the Permian Triassic boundary in South China. Science 289, 432-436.
- McKinney, M.L. 1995. Extinction selectivity among lower taxa – gradational patterns and rarefaction error in extinction estimates. Paleobiology 21, 300-313.
- Raup, D.M. 1979. Size of the Permo-Triassic bottleneck and its evolutionary implications. Science 206, 217-218.
- Sepkoski, J.J. Jr. 1996. Patterns of Phanerozoic extinction: a perspective from global data bases. In Global Events and Event Stratigraphy (Walliser, O.H., ed.), pp. 35-51, Springer.
- Song, H.J., Wignall, P.B., Tong, J.N., and Yin, H.F. 2013. Two pulses of extinction during the Permian-Triassic crisis. Nature Geoscience 6, 52-56.