
Isotopes across the PTB and climate change
A major objective on the 2004 expedition was to take samples for isotopic analysis. The key isotopes are those of oxygen and carbon. At the PTB, there is a dramatic shift in oxygen isotope values of marine carbonates, a decrease in the value of the δ18O ratio of about six parts per thousand (ppt), corresponding to a global temperature rise of about 6oC. Climate modellers have shown how global warming can reduce ocean circulation and the amount of dissolved oxygen, creating anoxia in the oceans; this is seen in marine sediments from around the world. The marine evidence for anoxia nearly world-wide is dramatic and convincing, and this episode of superanoxia, which surely killed much of the life on the sea bottom (Wignall & Twitchett, 1996), must form part of any model for events at the PTB.
Carbon isotopes have been hugely important in determining models for the PT mass extinction. Geochemists measure the ratio of the stable isotopes 13C and 12C in limestones and fossil shells, and even in carbonate palaeosols. In nature, most carbon occurs as 12C, with minor, but measurable, amounts of 13C. The ratio of these two isotopes in the atmosphere is the same as in the surface waters of the oceans. During photosynthesis, plants preferentially take up 12C to produce organic matter. If this organic matter is buried, rather than returned to the atmosphere-ocean system, then the atmosphere-ocean 13C: 12C ratio will shift in favour of the heavier isotope. Conventionally, this ratio is expressed as δ13C, which is the difference between the 13C: 12C ratios in the sample being tested and in a known standard.
In the ocean system, during times of high surface productivity, large amounts of organic matter are fixed at the surface and the surface waters of the ocean become (relatively) enriched in 13C. Shallow-water carbonate deposits are precipitated from this seawater, and record the seawater 13C: 12C ratio without any preferential uptake of one or other isotope. Therefore, during times of high surface productivity, shallow water carbonates record a positive shift in δ13C (i.e. towards the heavier isotope).
The PTB is characterized by a negative shift in δ13C, which is recorded in the carbonate deposits of all geological sections studied so far (e.g. Magaritz et al. 1988; Sephton et al., 2002), including terrestrial ones (Retallack 1995; MacLeod et al. 2000). On the face of it, this should imply a massive decrease in biological production and rate of burial of organic matter.
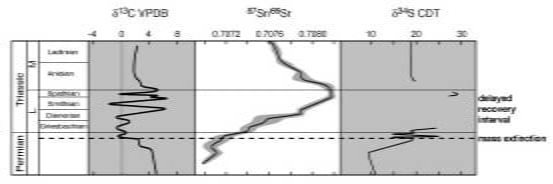 Summary of isotope curves across the Permo-Triassic boundary. Note that the δ13C record shows several major negative excursions, one at the PT boundary and several through the Early Triassic. The 87Sr/86Sr data show a steady increase across the boundary and well into the Early Triassic, perhaps reflecting increased erosion of radiogenic strontium from the land. The incomplete δ34S curve, measured from evaporates, reflects changes in ocean chemistry. Diagram courtesy of Frank Corsetti. |
However, the picture is more complicated (See Figure above). There is an initial short, sharp negative shift in δ13C, almost synchronous with the extinction horizon itself. The amount of negative swing varies between sections, but is typically 4-6 per thousand (Magaritz et al. 1988; MacLeod et al. 2000; Twitchett et al. 2001; Sephton et al. 2002). In most sections, a swing back towards the heavier end of the scale then follows. However, the δ13C values never swing right back to pre-extinction values, but remain lighter by some 0.5-1.5 per thousand. This relatively small difference can be explained by low productivity in the extinction aftermath. The initial shorter, sharper swing needs another explanation.Calculations have shown that the amount of negative swing (4-6 per thousand) is too great to be explained solely by a lack of biological production (Erwin 1993; Wignall 2001). An additional input of light carbon to the oceanÐatmosphere system is required. The CO2 emitted by volcanoes has a δ13C signature of -5 per thousand, but calculations show that even the output from the Siberian Traps could not cause the observed shift in δ13C. Even if all life was killed in an instant and the resulting biomass was incorporated into sediments, this would produce only 20% of the required isotope shift. The only viable source of light carbon is the methane trapped in gas hydrate deposits, which has a δ13C signature of -65 per thousand (Erwin 1993; Dickens et al. 1997; Wignall 2001; Berner, 2002). If these gas hydrates can be made to melt, enough methane would be released to cause the observed shift.
Kenneth MacLeod and colleagues (2000) had managed to extract carbon and oxygen isotope signals from carbonate palaeosols and from reptile bones at points through the Karoo successions. These showed the same pattern on land through the PTB in the Karoo as had been detected in so many marine successions before. But their task had been technically difficult because the entire Permo-Triassic succession of the Karoo has been lightly baked by the overlying Drakensberg volcanics of Early Jurassic age. This meant that the oxygen and carbon isotope signals could have been distorted or reset by the later heating, and the samples had to be treated repeatedly in acid to remove later-formed diagenetic calcite. We are fortunate with the Russian successions that they have not been metamorphosed by any later volcanics or tectonic activity. This means the carbonate samples should be easier to process. Initial results show the expected shifts in both carbon and oxygen isotopes at the PTB, but we await analysis of the more thoroughly sampled materials from the 2006 Expedition before drawing conclusions regarding atmospheric and climatic changes.
References
- Berner, R. 2002. Examination of hypotheses for the Permo-Triassic boundary extinction by carbon cycle modeling. Proceedings of the National Academy of Sciences USA, 99, 4172-4177.
- Corsetti, F.A., Baud, A., Marenco, P.J., and Richoz, S. 2005. Summary of Early Triassic carbon isotope records. Comptes Rendus Palévol, 4, 405-418.
- Dickens, G.R., Paull, C.K., and Wallace, P. 1997. Direct measurement of in situ methane quantities in a large gas-hydrate reservoir. Nature, 385, 426-428.
- Erwin, D.H. 1993. The great Paleozoic crisis: Life and death in the Permian. Columbia University Press, New York.
- MacLeod, K.G., Smith, R.M.H., Koch, P.L., and Ward, P.D. 2000. Timing of mammal-like reptile extinctions across the Permian-Triassic boundary in South Africa. Geology, 28, 227-230.
- Magaritz, M., Bar, R., Baud, A. & Holser, W.T. 1988. The carbon-isotope shift at the Permian/Triassic boundary in the southern Alps is gradual. Nature, 331, 337-339.
- Retallack, G.J. 2005. Earliest Triassic claystone breccias and soil-erosion crisis. Journal of Sedimentary Research, 75, 679-695.
- Sephton, M.A., Looy, C.V., Veefkind, R.J., Brinkhuis, H., De Leeuw, J.W., and Visscher, H. 2002. A synchronous record of δ13C shifts in the oceans and atmosphere at the end of the Permian. In (MacLeod, K.G. & Koeberl, C.; eds) Catastrophic events and mass extinctions: Impacts and beyond. GSA Special Paper. Geological Society of America, Boulder, Colorado, 455-462.
- Twitchett, R.J., Looy, C.V., Morante, R., and Visscher, H. 2001. Rapid and synchronous collapse of marine and terrestrial ecosystems during the end-Permian biotic crisis. Geology, 29, 351-354.
- Wignall, P.B. 2001. Large igneous provinces and mass extinctions. Earth-Science Reviews, 53, 1-33.
- Wignall, P.B. and Twitchett, R.J. 1996. Oceanic anoxia and the end Permian mass extinction. Science, 272, 1155-1158.